Experimental Subseasonal Forecast
Weather Regime Impacts Model - WRIMM
Atmospheric River Forecast
This forecast product gives the probability of an AR making landfall at different locations along the west coast. The forecast is from a statitical-dynamical hybrid model that uses forecasts of atmospheric circulation patterns from the ECMWF or NCEP models along with historical statistical information relating weather patterns to AR landfalls based on over 70 years of observations (Guirguis et al. 2020, 2022) using the SIO-R1 AR Catalog (Gershunov et al. 2017).
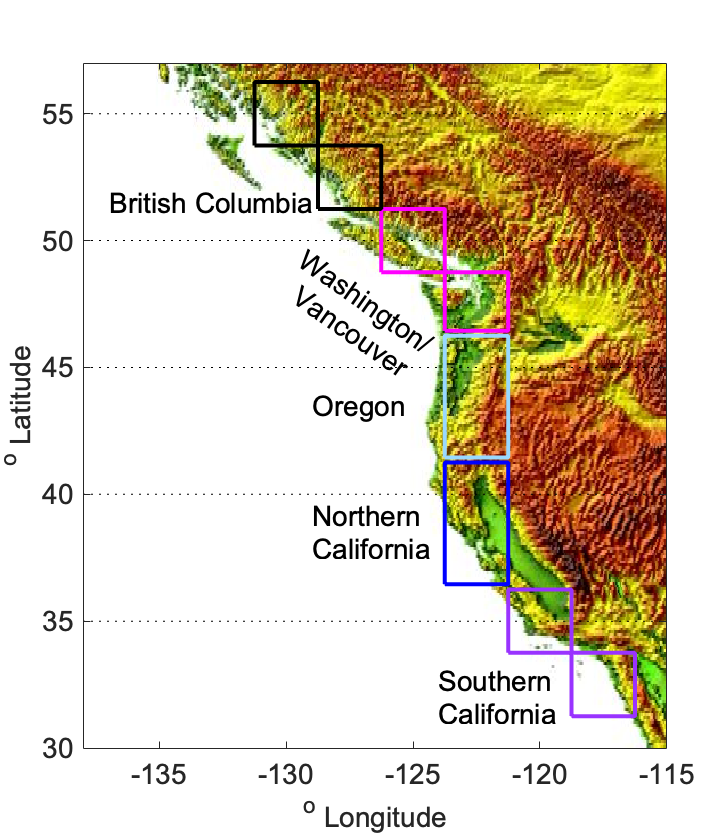
Figure 1. Focus regions for AR landfall analysis.
AR Landfall Probability Outlook


Figure 1. The probability of an AR making landfall at different locations (select tabs) along the West Coast using information about atmospheric circulation patterns from the ECMWF and NCEP models. The landfall probabilities (color scale) are shown relative to local climatology. Each diagonal line represents a forecast spanning 1-30 days lead time (y-axis). The forecast target dates are shown on the x-axis (Oct 1-Feb 28). Often at longer lead times there is too much uncertainty to issue a forecast.
Santa Ana Winds Forecast
Figure 2. The probability of SAW conditions over coastal Southern California using information from (a) the ECMWF model and (b) the NCEP model. Each diagonal line in (a) and (b) represents a forecast spanning 1-30 days lead time (y-axis). The forecast target dates are shown on the x-axis (Oct 1-Mar 31). Sometimes at longer lead times there is too much uncertainty to issue a forecast (NF=No Forecast), which is shown in gray. The daily probability of SAWs over Southern California (SAW Climatology) varies throughout the season, as shown in (c), where the y-axis and the color scale gives the average daily probability of Santa Ana winds.
Heat Wave Forecast
Coming Soon!
NP4 Mode Phase Forecast
This forecast product shows the dynamical model information that is used as input to the statistical forecasts of ARs, SAWs, and heat waves. We use the dynamical model forecasts of 500 mb geopotential height (Z500) fields from the ECMWF or NCEP models, which provides information about atmospheric circulation in our region of interest. From these Z500 fields, we determine the phases of four key modes of atmospheric variability in the region, which in physical terms tells us ridge/trough positions in our domain. These four key modes of atmospheric variability are called the "NP4 modes", and they have been identified as key drivers to weather variability and extreme weather impacts over California and the West Coast. Our methodology includes a filtering process, which identifies when there is low confidence about the mode phase (i.e., uncertainty about a developing ridge or trough), and in these cases the mode phase is classified as "uncertain".
Four Key Modes of Atmospheric Variability over the North Pacific Ocean