WY2023
Experimental Weather Regime Forecast
Four Key Modes of Atmospheric Variability over the North Pacific Ocean
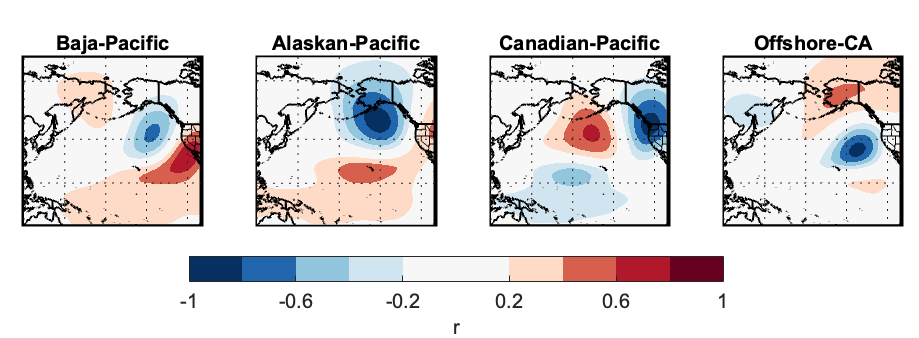
Figure 1. The loading patterns of four key modes of atmospheric variability over the North Pacific Ocean (called the "NP4 modes") identified using over 70 years of 500 mb geopotential height anomalies from NCEP Reanalysis, shown here in the positive phase. The daily interaction of these modes produce reoccurring weather patterns over the West Coast that modulate temperature, precipitation, and Santa Ana winds over California.
Most Recent Forecast: Updated Twice Weekly
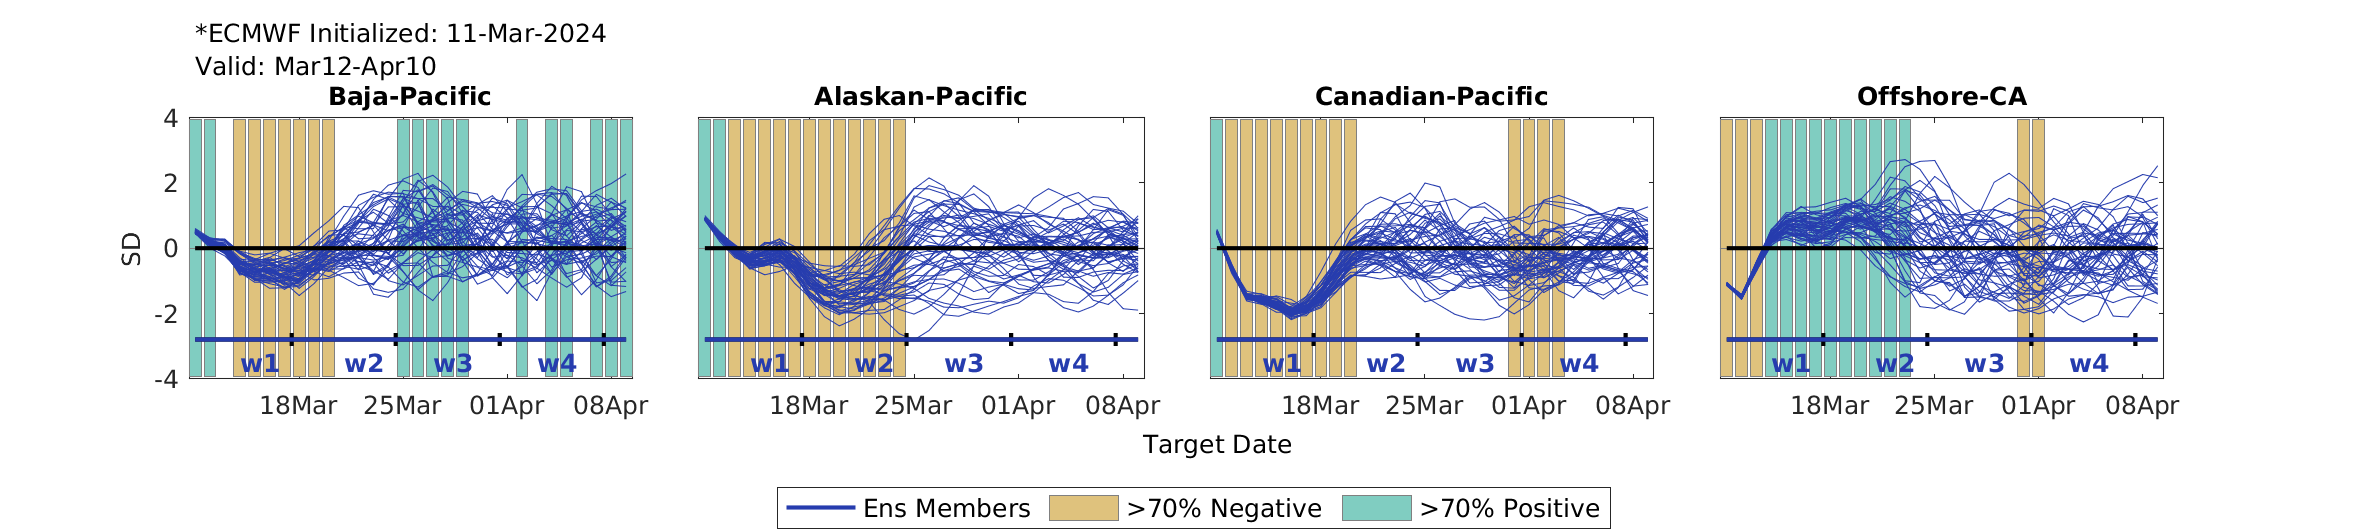

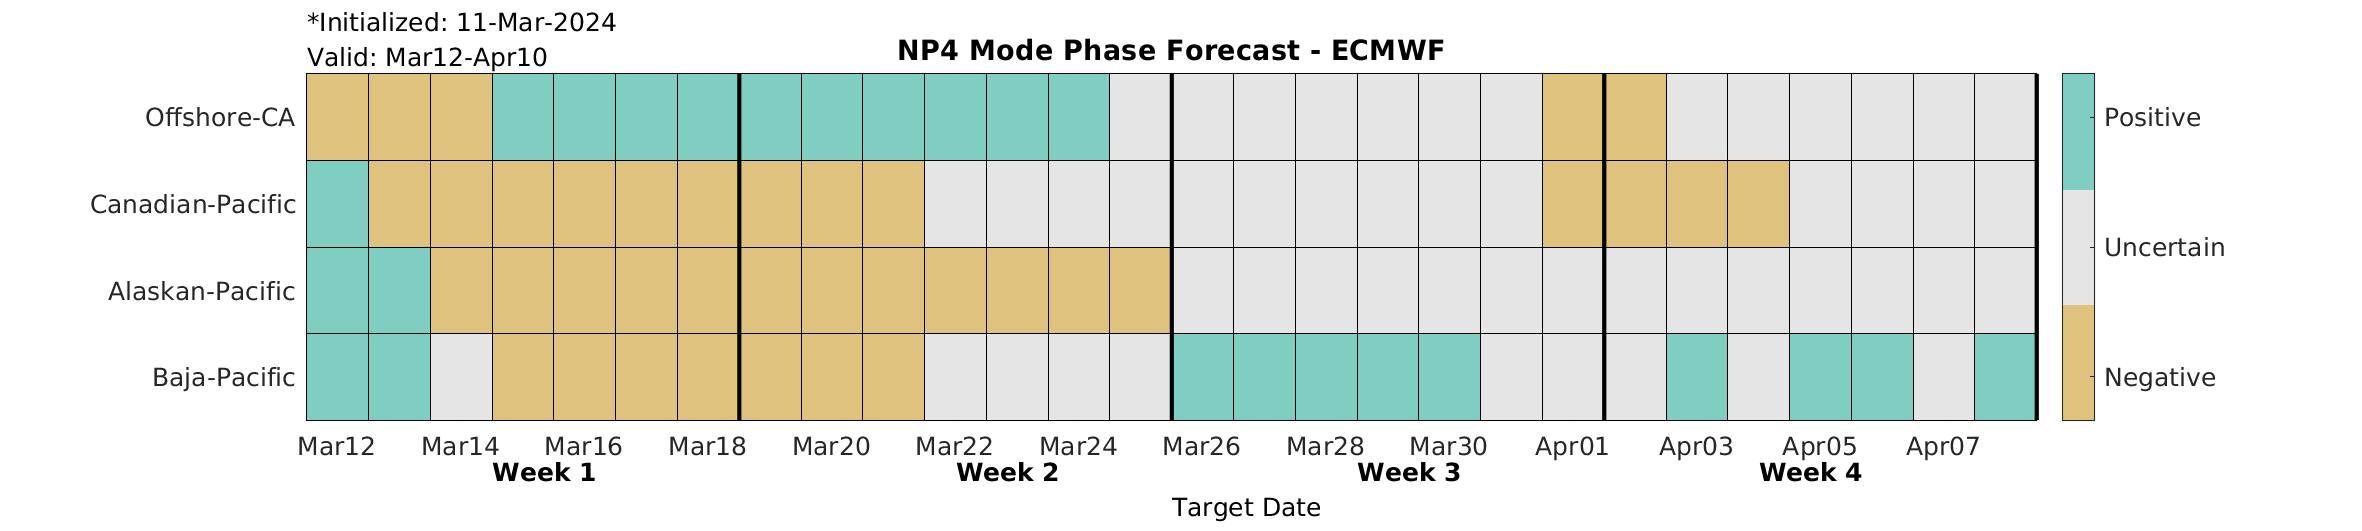
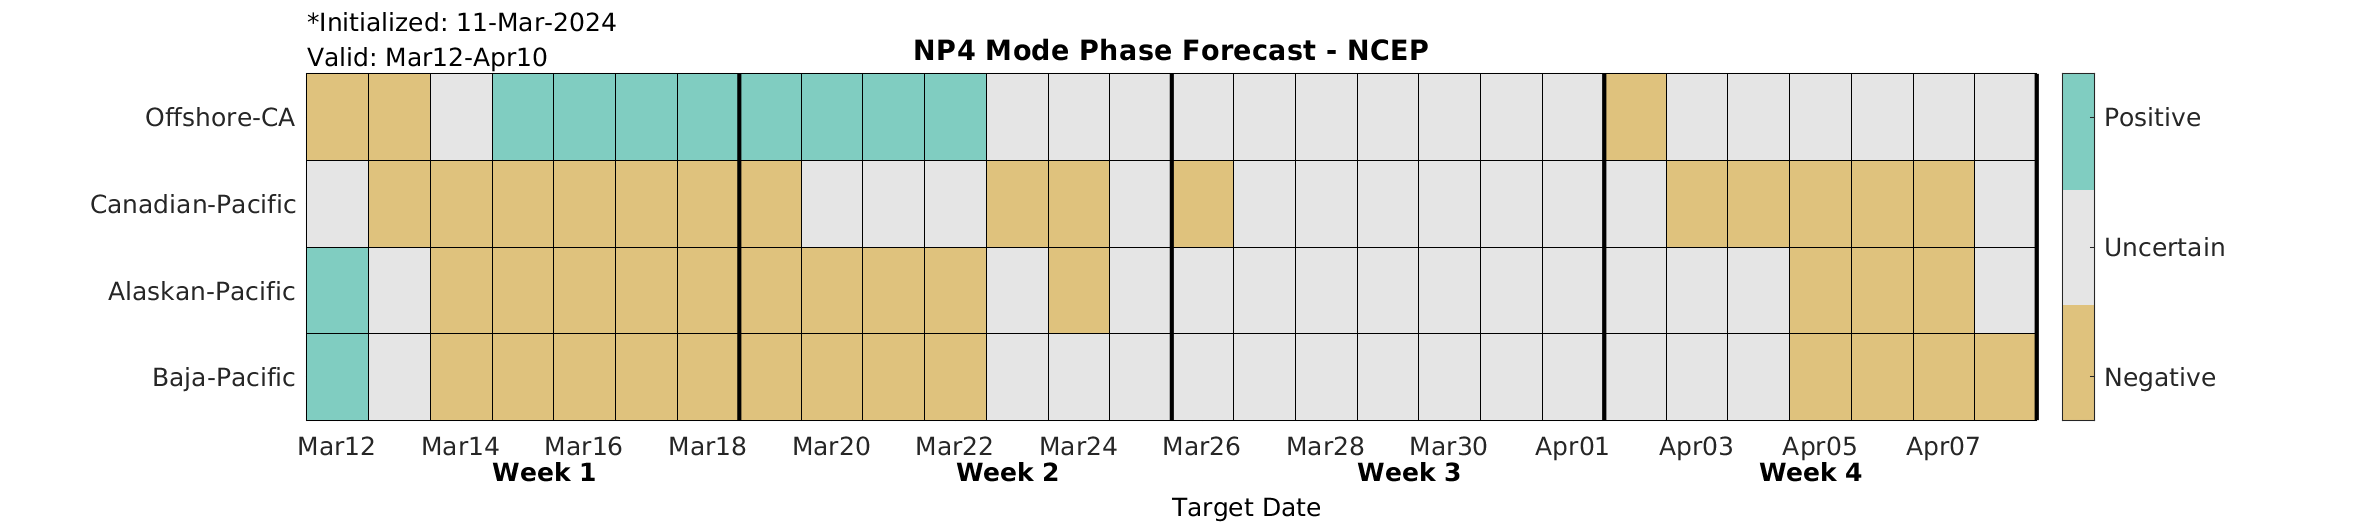
Figure 2. Shows the 1-4 week forecasts of the NP4 modes from the ECMWF and NCEP models. (A) shows the amplitudes of the four NP4 modes (Baja-Pacific, Alaskan-Pacific, Canadian-Pacific, and Offshore-CA modes) as forecast using the ECMWF (top) and NCEP (bottom) models. (B) shows the joint phase of the NP4 modes based on ensemble model agreement for the ECMWF (top) and NCEP (bottom) models. Green (beige) shading indicates where the ensemble members agree that a given mode will be positive (negative) while unshaded portions (white/gray) indicate uncertainty.
Weather Regime Forecast
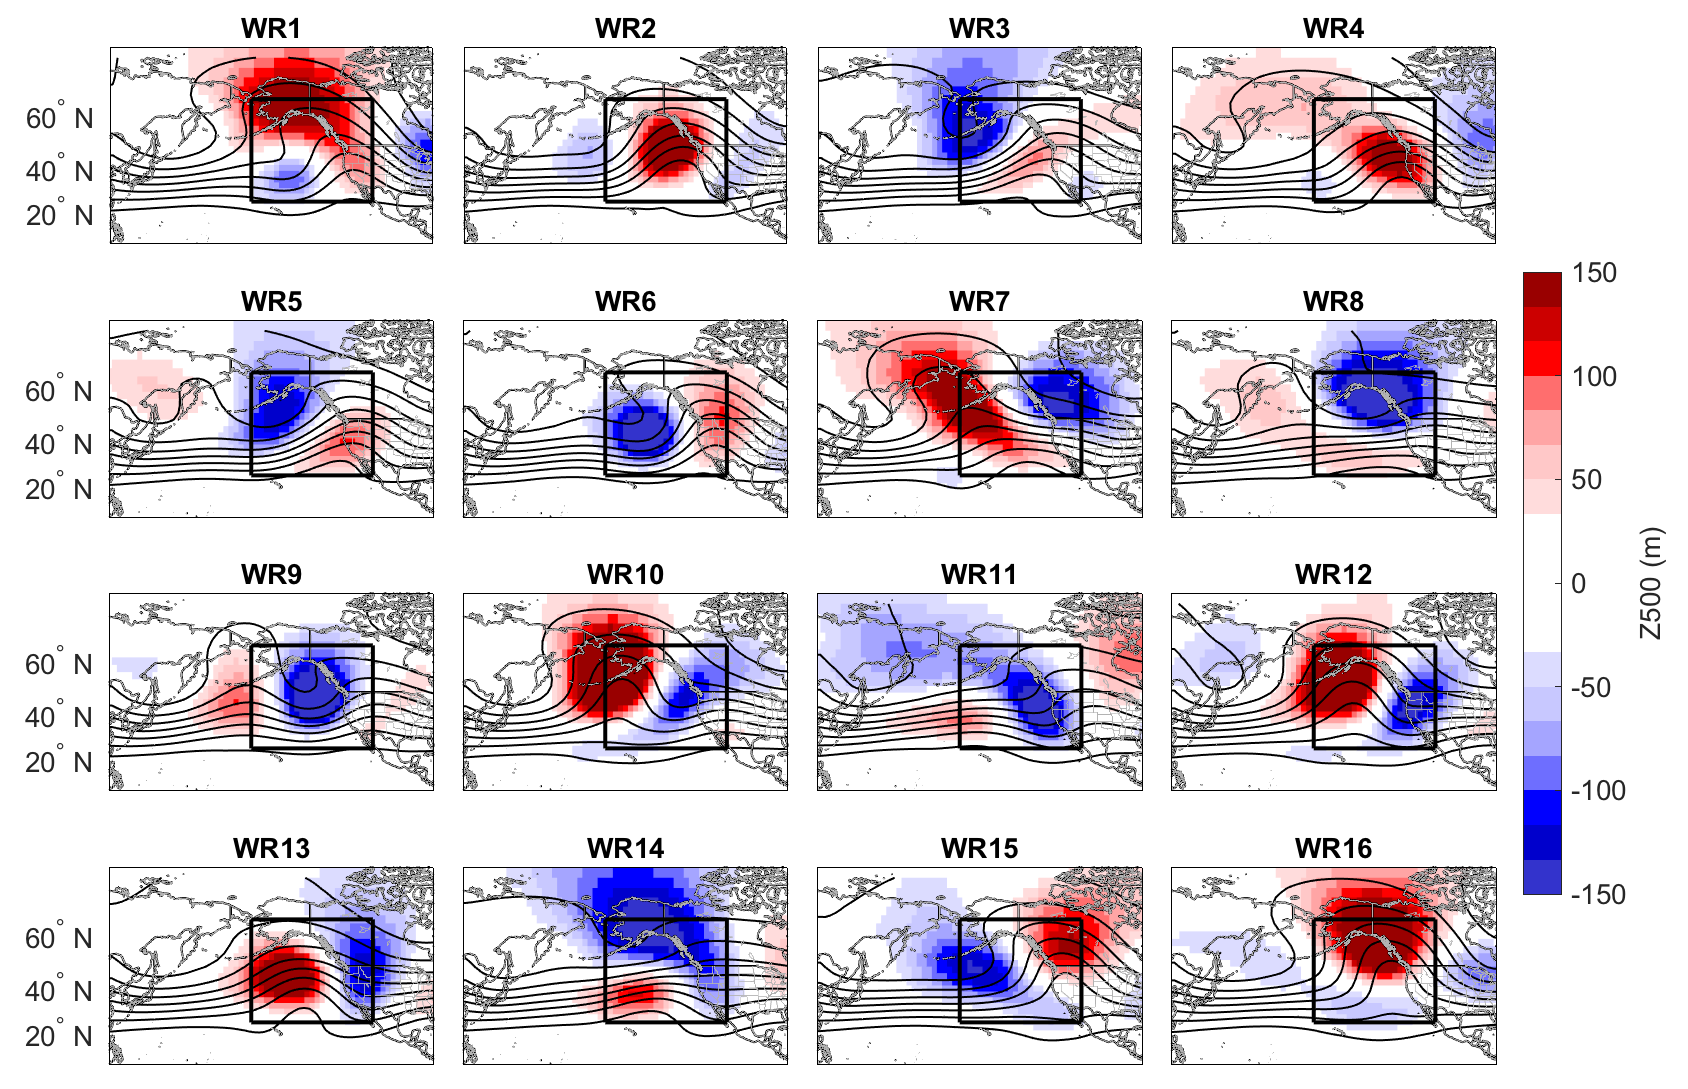
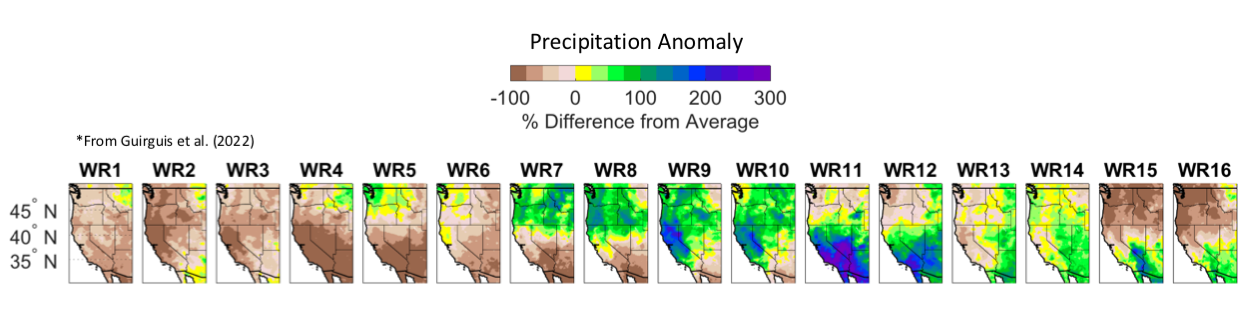
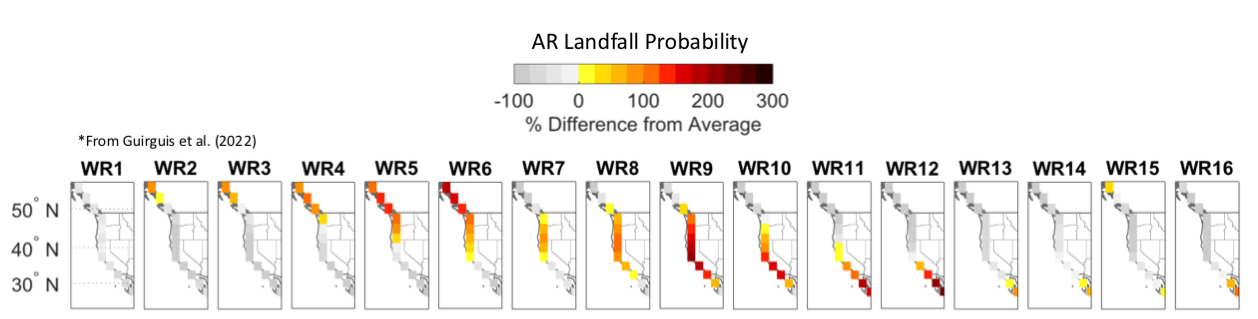
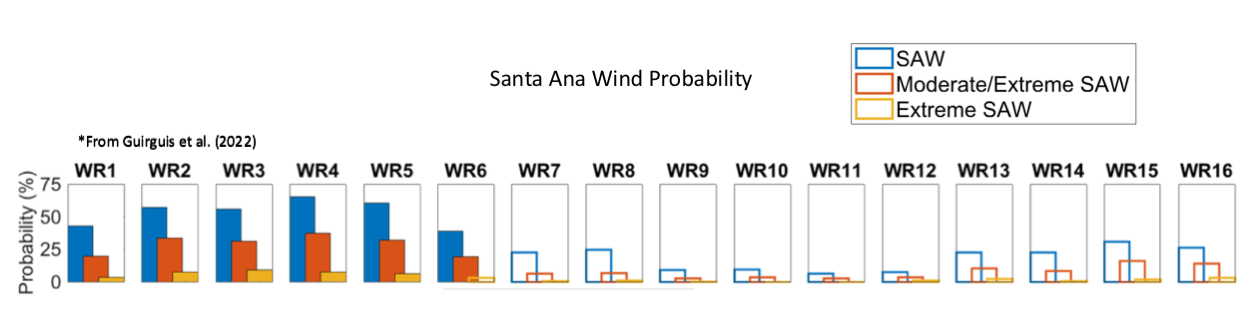
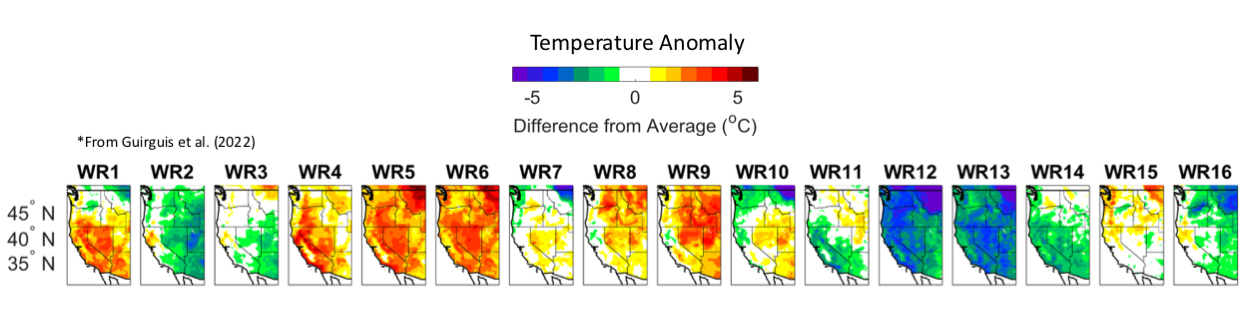


Figure 3. This compilation of images gives the weather regime forecast for the next 30 days. (A) shows the historical weather regimes as composites of 500 mb geopotential height anomalies based on over 70 years of observational analysis using NCEP Global Reanalysis data. (B) shows the impacts of each weather regime based on observational analysis for (select tabs) precipitation, atmospheric river landfalls, temperature anomalies, and Santa Ana winds probability based on historical analysis linking each weather pattern to daily weather impacts. (C) gives the weather regime probability using information from ECMWF(top) and NCEP(bottom).
Predictability of the NP4 Modes during WY2023


Figure 4. These figures provide near real-time skill information about the NP4 mode phase forecasts. The top row shows the loading patterns of the NP4 modes, displayed in the positive phase. The second row shows the observed amplitude and phase of each NP4 mode using 500 mb geopotential height data from NCEP Reanalysis (select tabs to view each mode). The bottom two rows show the 1-30 day mode phase forecasts during WY2023. Each forecast is shown along a diagonal line, where the target date is given along the x-axis and the lead time is given along the y-axis. Green (beige) shading indicates where 70% of ECMWF or NCEP model ensemble members reached a consensus about the positive (negative) phase of a given mode, and gray shading is where the ensemble members did not reach this level of agreement (uncertainty). White space indicates unavailable or missing forecasts. The blue vertical line indicates the end of the validation period. To the left of the blue line, the forecasts have been validated against the observations with error shown in red.